USDA Snow Survey Provides Updated Water Supply Outlook Report for Utah
Author
Published
5/13/2025
Most of the annual streamflow in the western United States originates as snowfall that has accumulated in the mountains during the winter and early spring. As the snowpack accumulates, hydrologists estimate the runoff that will occur when it melts. Measurements of snow water equivalent at selected manual snow courses and automated SNOTEL sites, and this data is used in statistical and simulation models to prepare runoff forecasts. Unless otherwise specified, all forecasts are for flows that would occur naturally without any upstream influences.
Forecasts of any kind, of course, are not perfect, and streamflow forecast uncertainty arises from three primary sources: (1) uncertain knowledge of future weather conditions, (2) uncertainty in the forecasting procedure, and (3) errors in the data. As the season progresses, forecasts become more accurate, primarily because a greater portion of the future weather conditions become known. Users should take this uncertainty into consideration when making operational decisions by selecting forecasts corresponding to the level of risk they are willing to assume about the amount of water to be expected.
Shortly after we published last month’s version of the Water Supply Outlook Report on April 4th, our snowmelt in Utah (which had already begun since our state snowpack peaked on March 23rd) accelerated to the point where, as of only a week later, all of Utah’s basins had below normal snowpack. A couple of weeks after that, only the Bear watershed was close to normal at 91%. Central Utah watersheds ranged from 50% to 70% of normal, and all of Utah’s southern basins were below 50% of normal — with Southeastern Utah and the Escalante-Paria basin showing almost no measurable snow at our SNOTEL sites. This rapid deterioration of our snowpack occurred due to well-below normal precipitation during April, early snowpack ripening, and (generally) above-normal temperatures across the state. Resultingly, the water supply forecasts issued in this report predict substantially lower runoff volumes than those from last month.
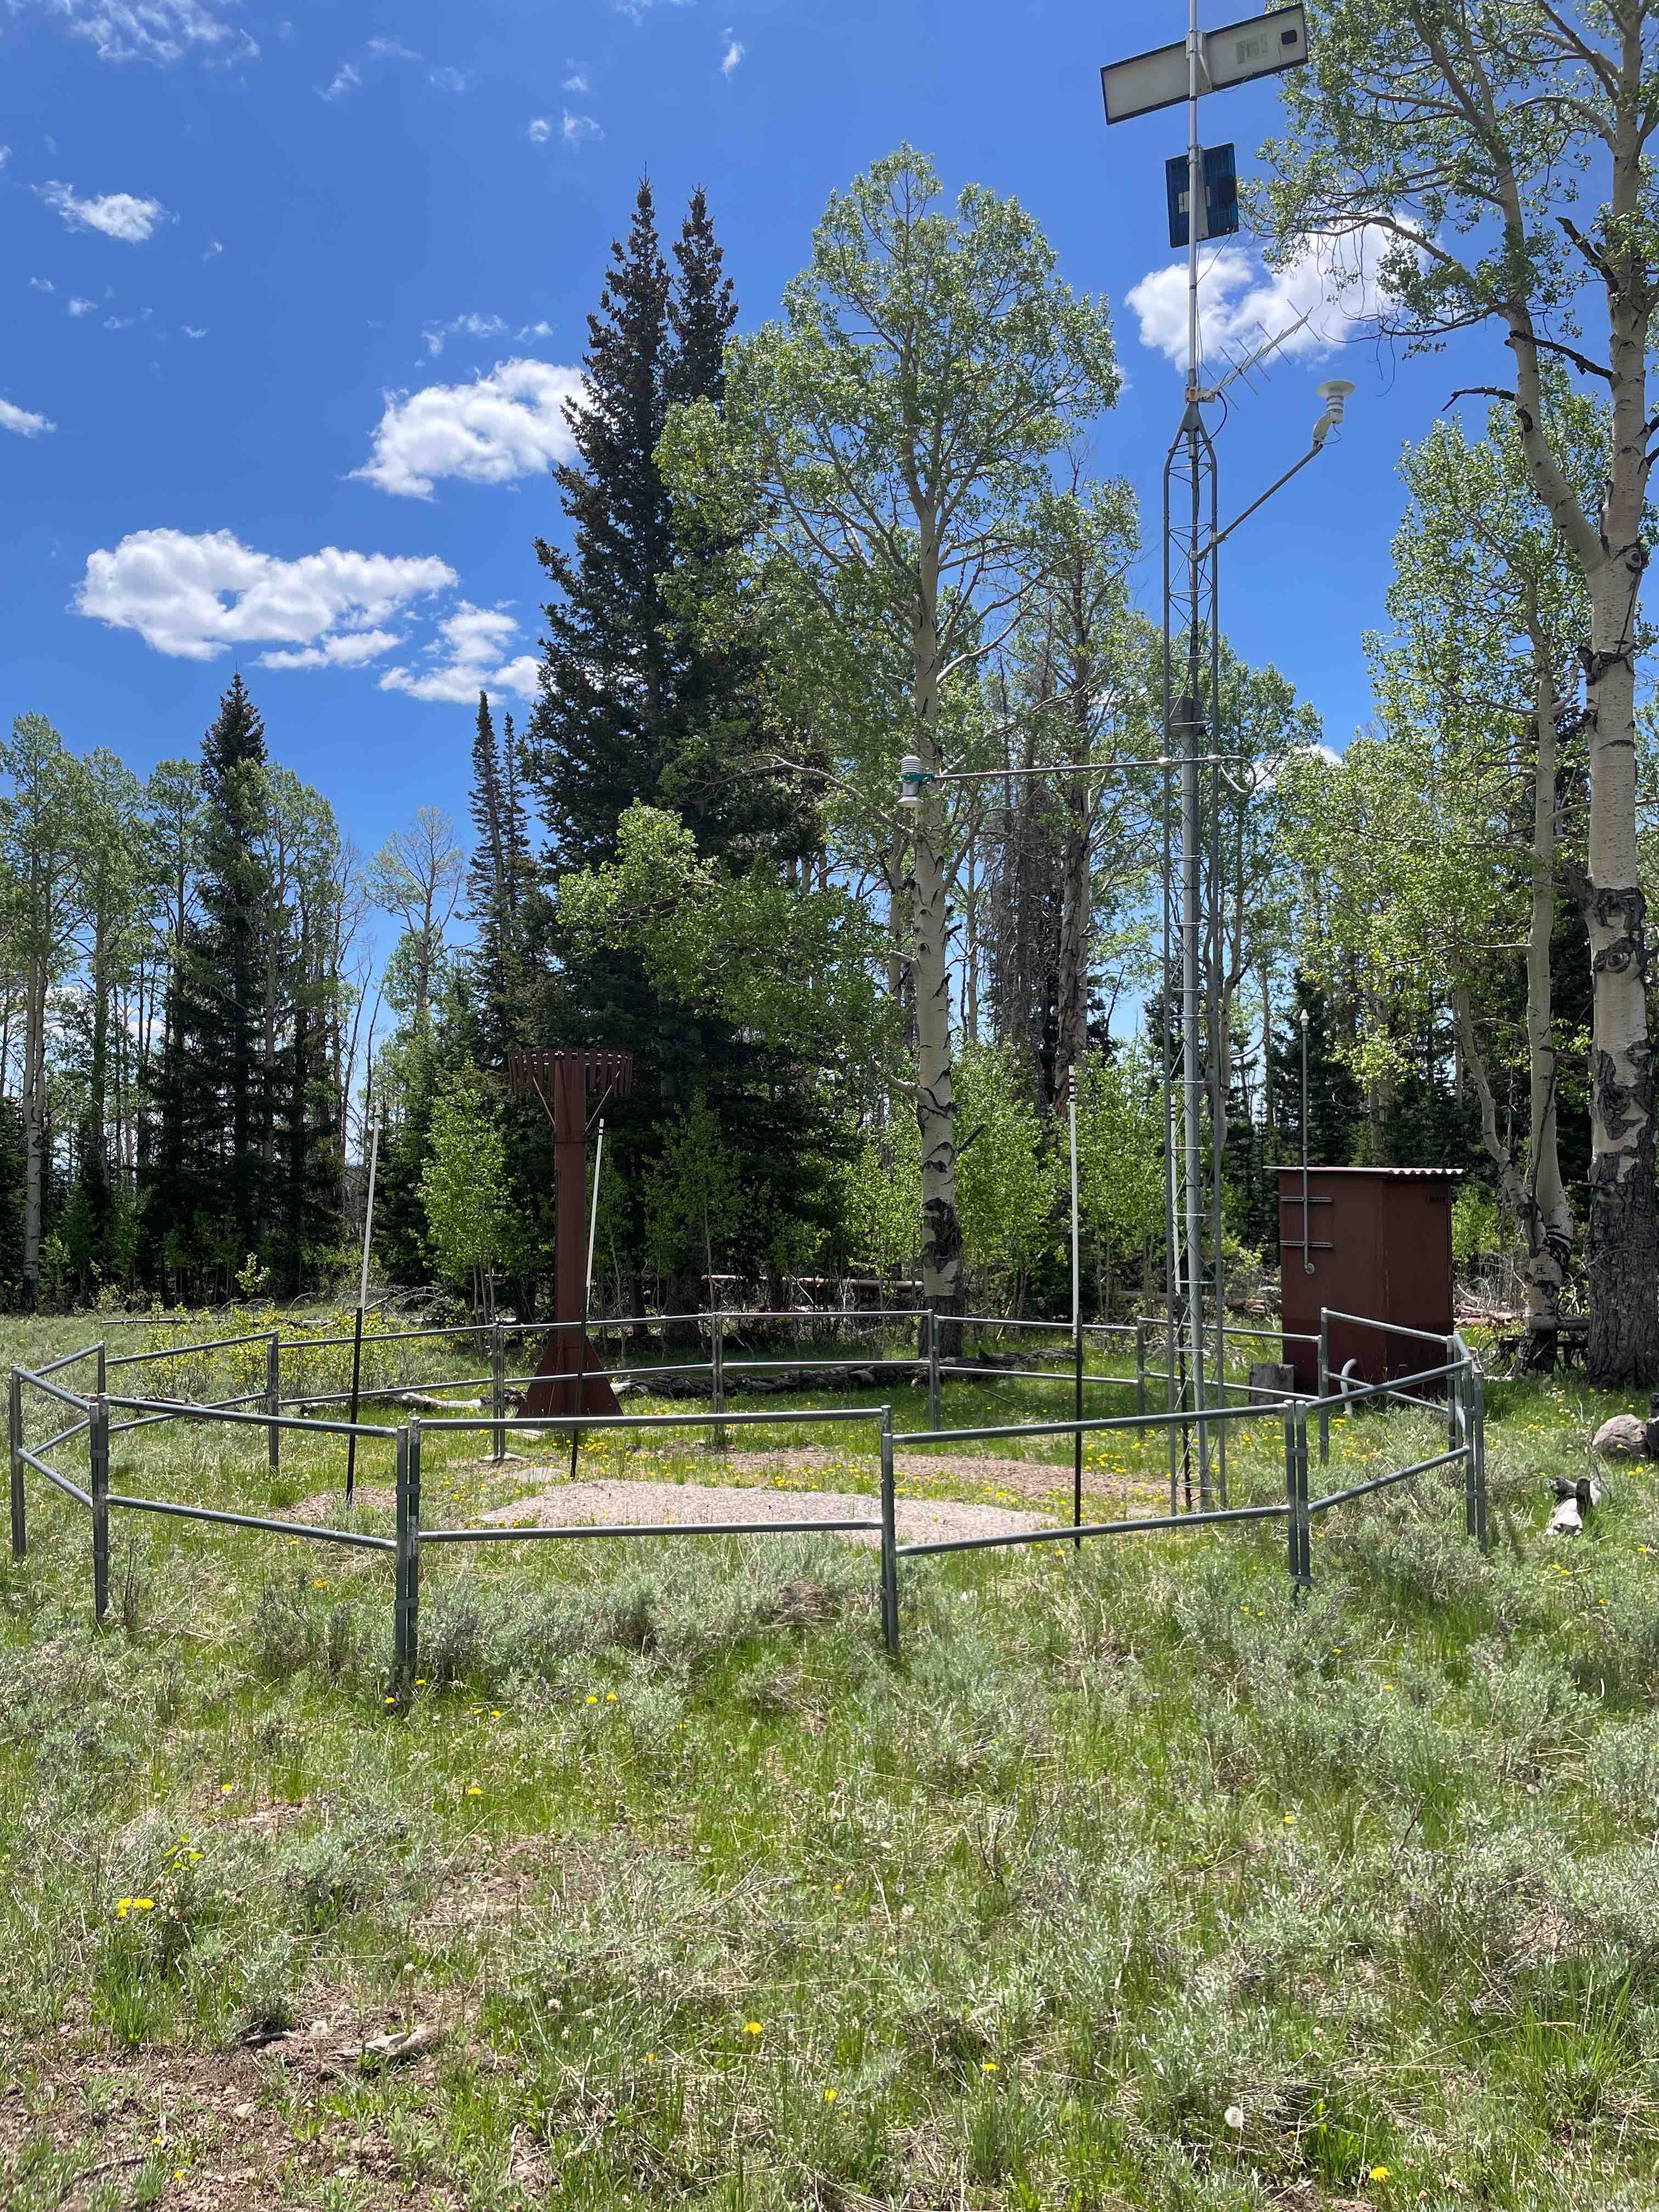
Castle Valley SNOTEL site in southern Utah (east of Brian Head)
As noted throughout our reports this winter and spring, indexed statewide conditions do a poor job of reflecting the important and drastic differences in snowpack conditions that impacted northern versus southern Utah this year. That said, we provide the statewide values herein to facilitate comparisons with other years. As of May 1st, Utah’s statewide snow water equivalent (SWE) was 64% of normal (39% lower than last year’s May 1 value, and a 28% drop from last month). April precipitation in Utah was well below normal at 57%, which lowers the statewide water-year-to-date precipitation value to 93% of normal. As of May 1st, northern Utah major watersheds had received generally close to normal water year precipitation, while southern Utah basins were well below normal.
Our staff use previously-identified saturation points for soil moisture at each one of our sites to obtain percent of saturation values at our 2”, 8”, and 20” sensor depths. Data from across Utah’s SNOTEL network is then amalgamated to produce a singular, statewide value for soil moisture percent of saturation that can be compared with previous years.
When we look at May 1st conditions through that lens, our mountain statewide soil moisture is at 72% of saturation (very close to normal), compared with 77% at this time last year. As for other parameters, however, soil moisture varies significantly across the state, with extremely dry mountain soils in the Escalante-Paria, Upper Sevier, Southeastern, and Southwestern regions. In fact, mountain soils in Southwestern Utah have been record-dry since April 18th and remain well below previous minimums. Similarly, soil moisture levels in the mountains of Southeastern Utah have been record-dry since April 23rd and also continue to set historic minimums. Elsewhere in southern Utah, the situation is only marginally better. In addition to the concerns these conditions generate about our snowmelt runoff, Utahns should be aware that the dry mountain soils and early snowmelt have the potential to increase the risk of forest fires.
Utah’s reservoir storage is currently at 83% of capacity, a decrease of only 4% from last year. Utah continues to be second only to Oregon in the Western U.S. for how full its reservoir system is. Most areas of the state currently have similar reservoir storage levels as at this time last year, although storage in Southwestern Utah and the Upper Sevier is somewhat depleted. We encourage Utahns to continue conserving water to help maintain as much water in our reservoirs as possible, providing a buffer against potential below-normal water supply conditions in the future.
As noted above, NRCS streamflow forecasts for snowmelt runoff volume have come down a bit from the April 1 to May 1 predictions due to the below-normal precipitation received in Utah during April. A new NRCS tool allows our users to view how individual forecasts have evolved over time. These plots are also available on our website by clicking the “Streamflow Forecasts” box. Geographically, our water supply forecasts continue to reflect this year’s snowpack and precipitation patterns, such that extremely poor snowmelt runoff is forecasted for southern Utah, while northern Utah forecasts are more optimistic, albeit still somewhat to well below normal. Values range from 7% to 35% of average for the Southeastern Utah, Escalante-Paria, and Southwestern Utah regions, with the Upper Sevier only slightly better.
Further north, the Price-San Rafael and Duchesne basins have snowmelt runoff predictions in the 50% to 82% of average range. Closer to the Wasatch Front, the forecast numbers vary widely; from as low as 28% of average for W Canyon Creek near Cedar Fort to as high as 93% of average for the Provo River at Woodland. The Colorado Basin River Forecast Center (CBRFC) produces peak flow forecasts in addition to volumetric water supply forecasts. For example, their map of 2025 peak flows predicts rivers in Southwestern Utah to peak at only around 10 to 25% of normal; elsewhere in the state peak flows are forecasted to peak around 50 to 80% of normal (central Utah), 30 to 70% of normal (Duchesne basin), and 15 to 70% of normal (Wasatch Front region). The East Fork of the Virgin River near Glendale’s forecasted peak flow percentile is zero, suggesting that it may set a record for the lowest peak flow since the stream gage was installed in 1970. In fact, this year’s peak for that river is predicted to be significantly below the previous minimums set in 1990 and 2002. Pulling back to the watershed scale, (not surprisingly), the lowest percent-of-average region was the southwest corner of the state.
To expand upon conditions in Southwestern Utah, current streamflow observations provided by the U.S. Geological Survey (USGS) for the Virgin River have already been flirting with historic lows, and many USGS gages in Southwestern Utah are reporting streamflows in the bottom 10th percentile. As noted above, soil moisture values in Southwestern Utah are breaking records for dryness, water supply forecasts are exceptionally low, and peak runoff forecasts are predicted to be in the bottom 15th percentile, if not record-setting. Despite resilient reservoir supply conditions, we remain very concerned about the water supply outlook in Southwestern Utah this summer due to these factors. In fact, the Surface Water Supply Index (SWSI) values for the Virgin and Upper Sevier Rivers, which combine current reservoir levels in each basin with the volume of runoff predicted by these May 1 streamflow forecasts, rank below the bottom 15th percentile, again suggesting that this area of the state will have well below-normal water supply conditions.
Snow water equivalent in the Great Salt Lake (GSL) basin was at 72% of normal as of May 1st, compared with 108% at this time last year. Basin-wide precipitation in April was very poor (52% of normal), bringing the water year-to-date value down to 98% of normal. Soil moisture is close to normal at 75% of saturation, and the basin’s reservoir storage is at 87% of capacity. Our GSL inflow forecast for May through July ranges from 94,000 acre-feet to 625,000 acre-feet, with the most probable value closer to 32,000 acre-feet (64% of the average). Similarly, our predictions for lake level rise from May until peak lake stage range from 0.1-0.7 feet, with a 50th exceedance probability (most probable) rise of around 0.3 ft. On May 1st, the south arm of the GSL was at 4193.4 ft elevation, so our expectation is that the lake will peak at around 4193.7 ft stage this year, which is down 0.3 ft from our prediction provided last month in the April version of this report.
This is our final Water Supply Outlook Report for the current water year. Monthly reports will recommence starting next winter. For questions or information in the meantime, please visit our website, https://www.nrcs.usda.gov/utah/snow-survey.
Want more news on this topic? Farm Bureau members may subscribe for a free email news service, featuring the farm and rural topics that interest them most!